HOW BUILDERS ARE MANAGING RECENT MARKET CONDITIONS
September 8, 2023
Despite many signs of optimism in the housing market, there are still challenges for builders to deal with. Being aware of those challenges and developing a strategy to overcome them is a key component of a business’s success. Let’s take a look at many of the issues facing builders today and how they are responding to them.
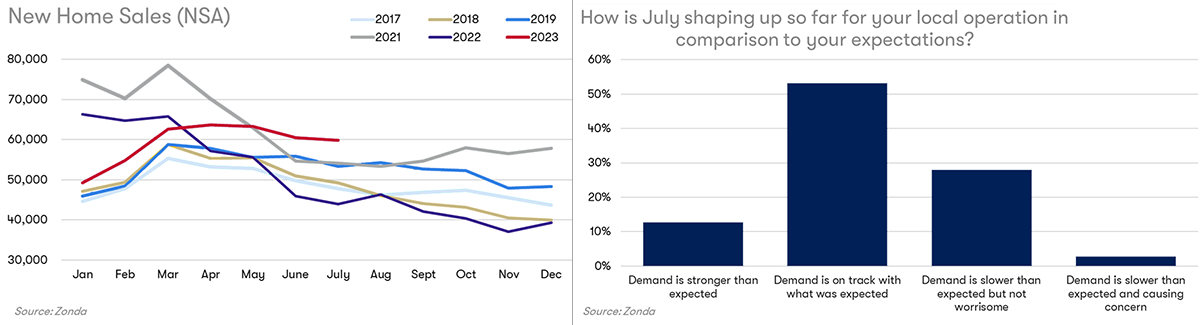
2023 has so far outperformed 2017-2019 so far in terms of new home sales. There’s some seasonal slow-down this year, but no dramatic decreases at this point. This fits with Zonda’s recent survey of builders. When asked about how July was shaping up, over half said that “Demand is on track with what was expected” while slightly less than 30% acknowledged that demand was slower than expected, but wasn’t worrisome.
BUILDERS’ RESPONSE TO HIGH MORTGAGE RATES & AFFORDABILITY HURDLES
Builders still have pricing power. Although 51% of builders haven’t increased their base prices, 44% have. However, they’re being more cautious than in 2022, and raising them by smaller dollar amounts.
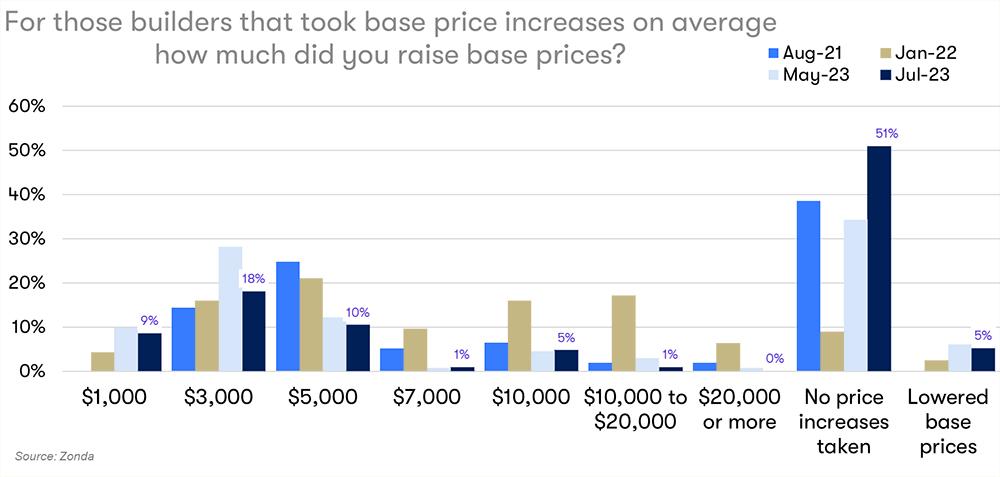
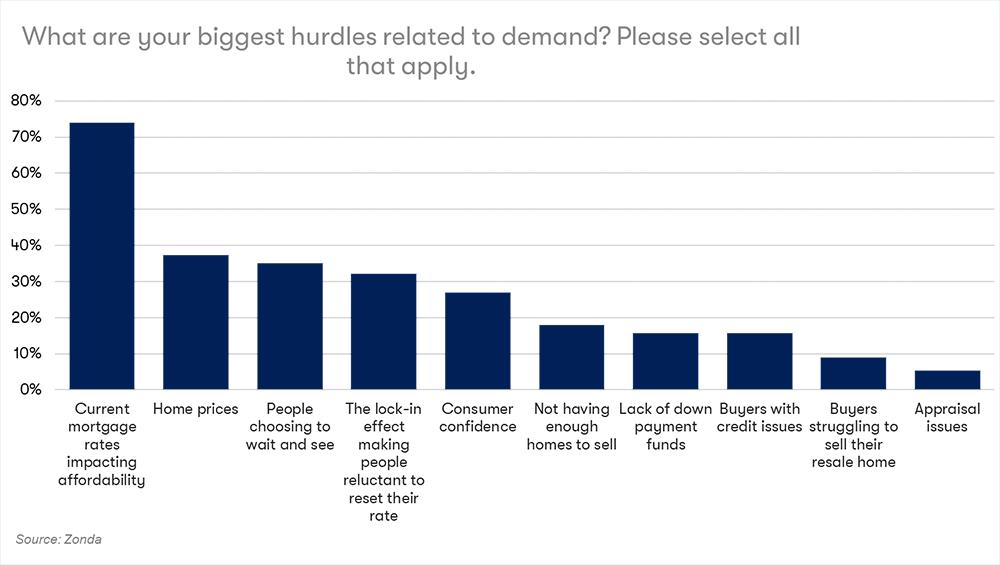
Because builders are saying that the top two challenges to demand are current mortgage rates and overall home prices, it makes sense not to raise prices dramatically.
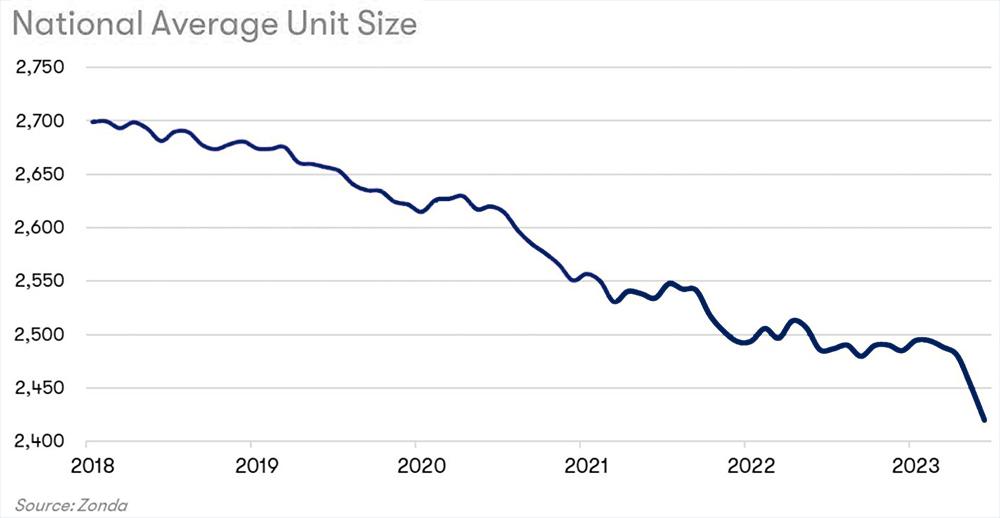
Builders catering to the luxury market may not have felt the need to change their product and, in fact, 37% of builders haven’t done so. However, other builders have changed their product offerings. 25% are paring back features and 38% are building smaller homes. Smaller unit sizes is a national trend that’s been going on since at least 2018 (despite a blip of increasing square footage during the pandemic). But the recent drop has been particularly significant — 10% smaller floorplans since this time last year.
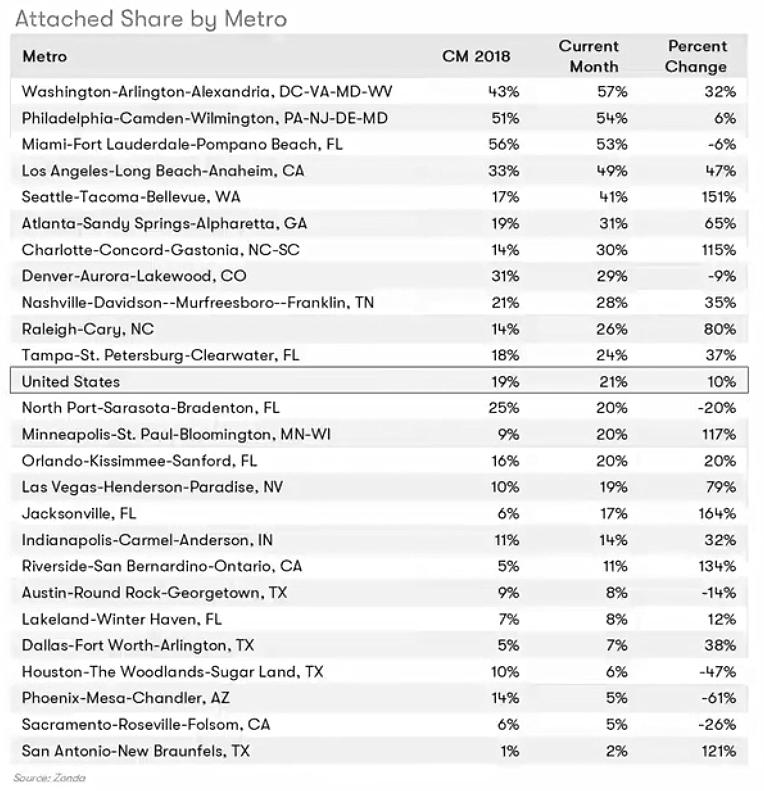
Attached homes (such as a duplexes or townhouses) aren’t guaranteed to be priced lower. But when other factors come into play — such as higher density and what else is available in the market — they often have a lower price. Over the past 5 years, the share of attached homes being offered has increased by 10%. Currently 21% of new homes for sale nationally are attached.
In some metro areas, the share of attached homes being offered has decreased (the biggest drop is -61% in Phoenix, Arizona). But, in most areas, the share of attached homes being offered has increased. In Washington DC, 57% of homes currently offered are attached, and 54% are attached in Philadelphia.
Overall, builders are providing a greater variety of product type — attached as well as detached, some smaller homes, some with pared back features.
BUILDERS WANT TO BUILD — BUT THEY HAVE CONCERNS
Although the things mentioned above can improve affordability, many consumers still haven’t been able to buy. And, Wolf says, “More building could help with affordability.” However, almost all of the 25 markets with the most starts over the past four quarters have fewer starts than the previous four quarters. (Although – Wolf also mentions that in almost every market the second quarter of this year has more starts than the first quarter.)
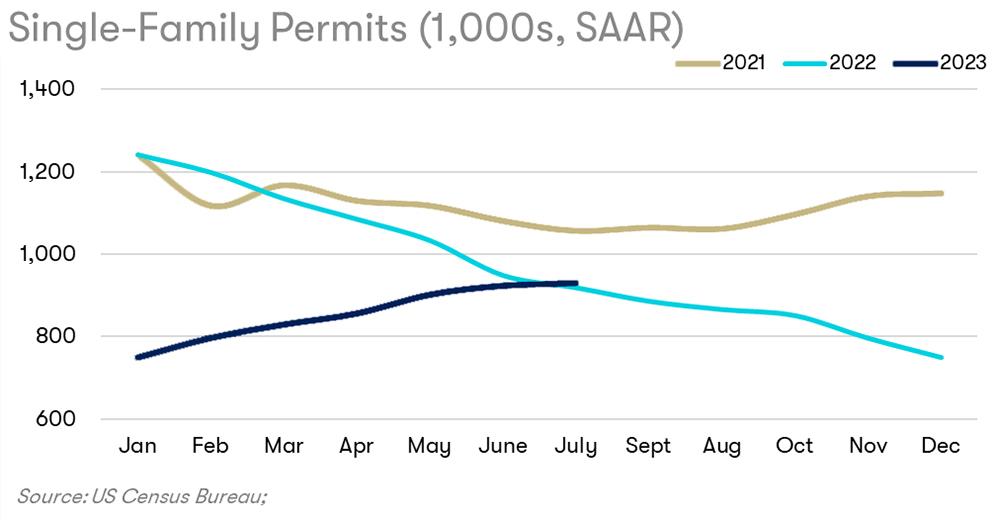
Single-family permits have also increased over the course of this year which reflects builders’ enthusiasm to construct more homes.
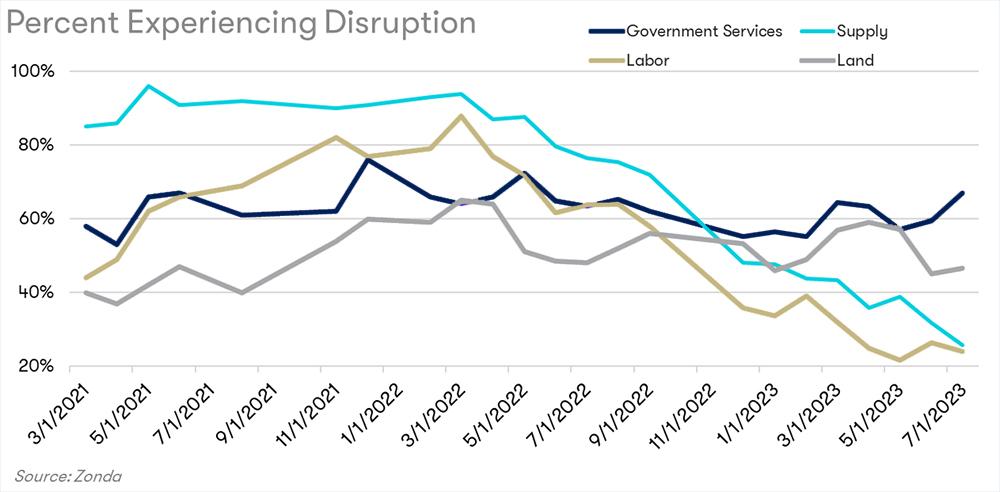
However, builders do have concerns — particularly about the cost of land and delays in permitting and entitlement. The percentage of builders reporting disruption to their operations from each of these issues is significantly greater than those reporting disruptions due to labor. (Labor issues peaked in March 2022, when almost 90% of builders reported them. Now, that’s less than 30%.)
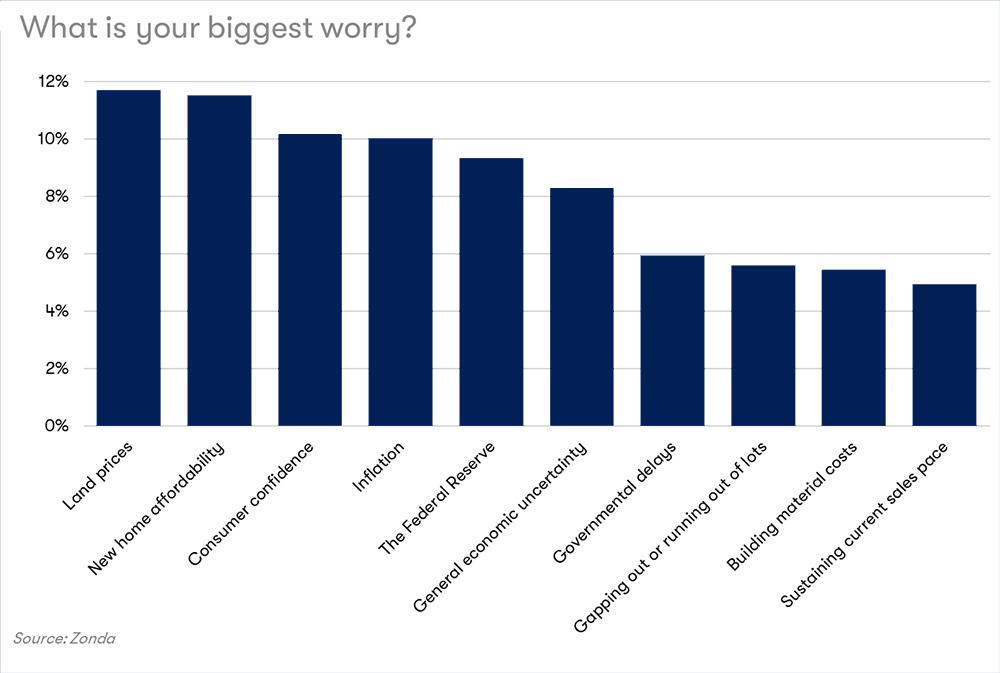
Builders say government services are the biggest disruption to their operations. But their biggest worry is the cost of land. Their second biggest worry is new home affordability. And, of course, these are intimately related since land accounts for 20-50% of the final price of a home, depending on the market.
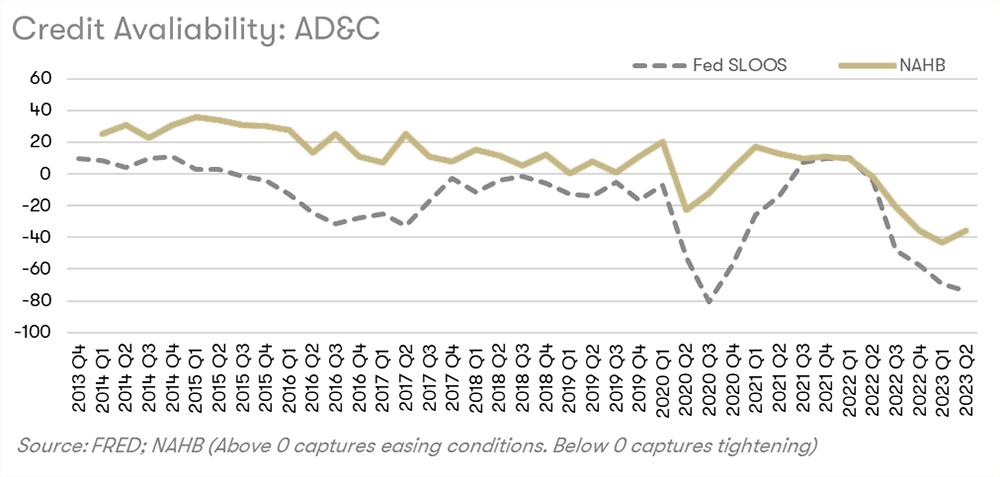
When asked in July, 56% of builders thought they’d start more homes this year than in 2022. But whether they can build depends on financing and the availability of credit has been tightening over the course of this year. Credit availability for public builders and large private builders is not a concern. For smaller private builders, it may be more difficult for them to get credit, and thus more difficult for them to start homes.
BUILDERS’ LAND ACQUISITION STRATEGIES
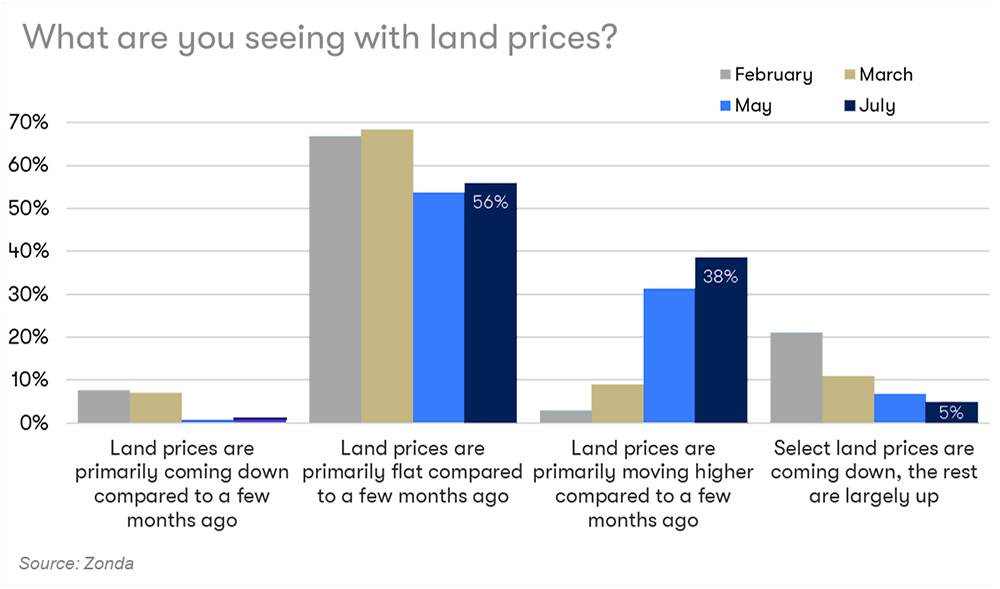
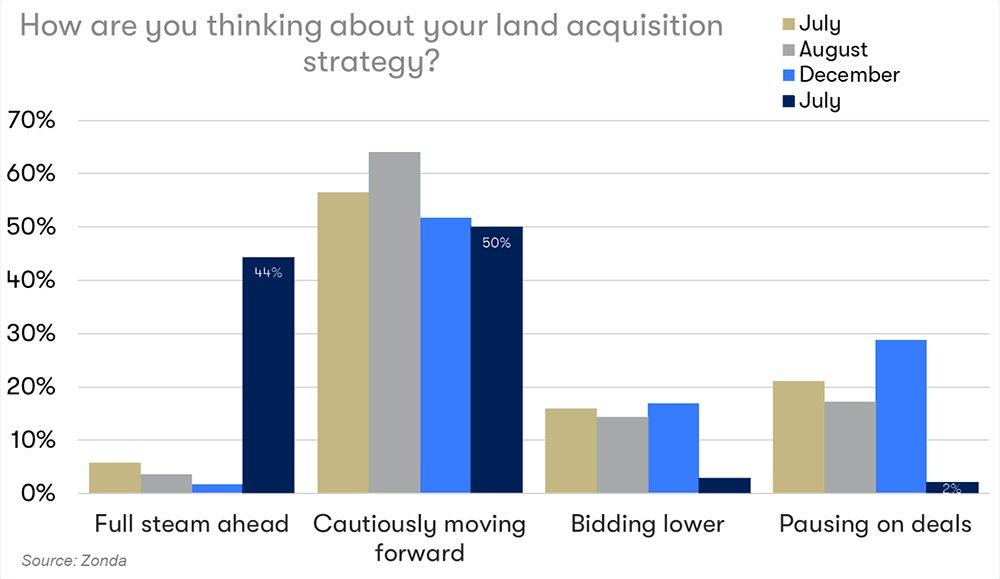
56% of builders say land prices are mostly flat compared to a few months ago, but 38% of builders say they’re increasing. Nevertheless, 44% of builders are “full steam ahead” on acquiring land — a massive increase on previous months. 50% are “cautiously moving forward” — a decrease from previous months. Very few builders are bidding lower or pausing on deals.
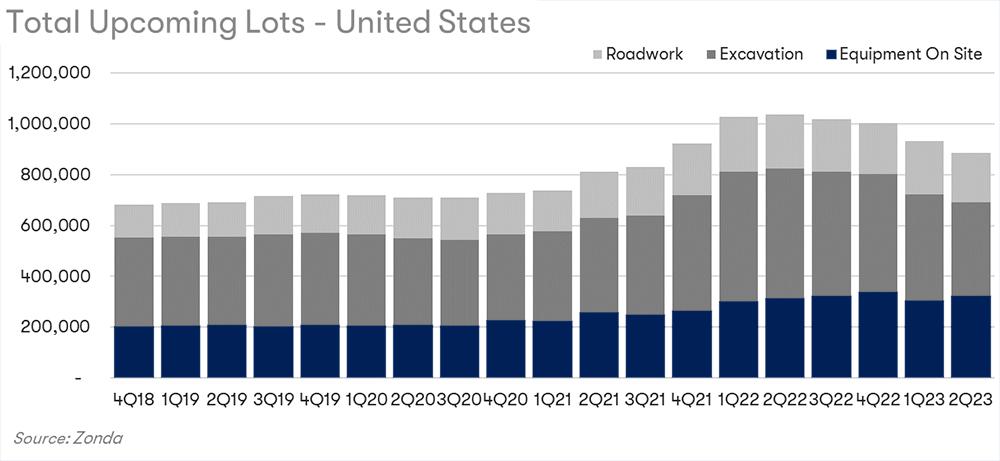
UPCOMING LOTS
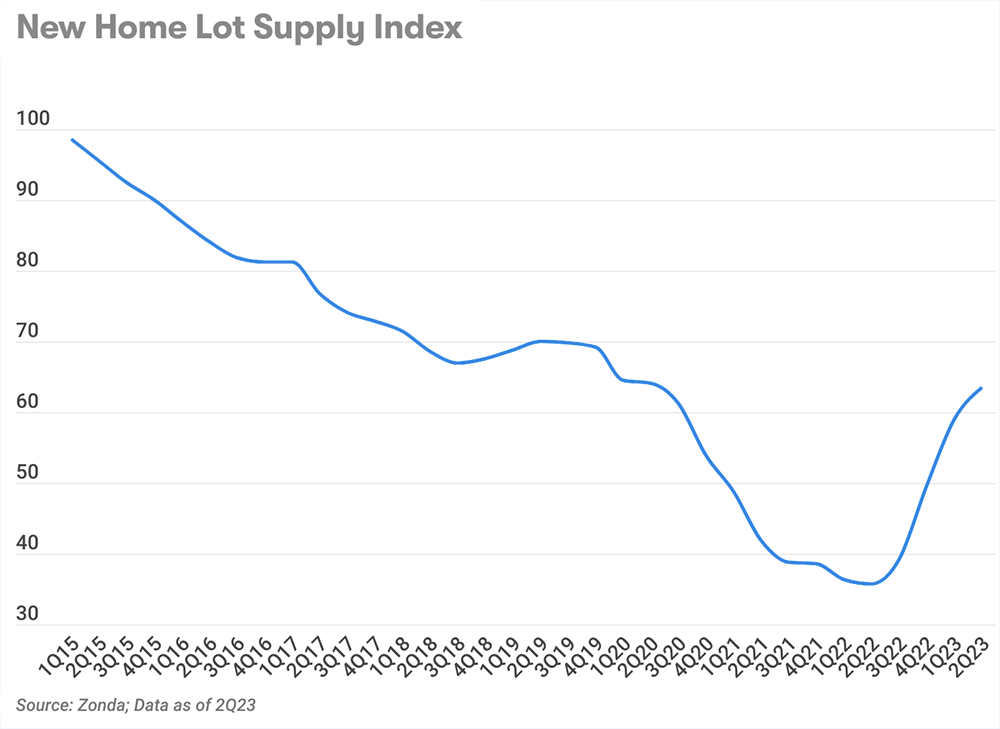
The chart below shows the national availability of VDLs (vacant developed lots), ready for homes to be built on. Nationally, the availability of lots has increased dramatically since the beginning of 2022 due to slower starts. In most markets, the current VDL supply is higher than in 2019.
Despite this uptick, the market is still significantly undersupplied. Wolf expects that curve to either flatten out or turn downward — depending on start activity.
In many markets across the country, a small percentage of lots are expected to be ready for homebuilding as soon as the third quarter of this year. (I.e. very few are currently at the “streets in” phase of development.)
By 2024, a much larger proportion of the lots in each market should be ready for building. These lots are currently under excavation.
This table shows development was pretty steady through 2018 to 2020, at what Wolf calls “a pretty high level.” But lot development increased after the height of the pandemic, continuing to the second quarter of 2022, and falling since then. Wolf thinks this up-and-down pattern is a reflection of wavering uncertainty about the market.
PENT-UP DEMAND
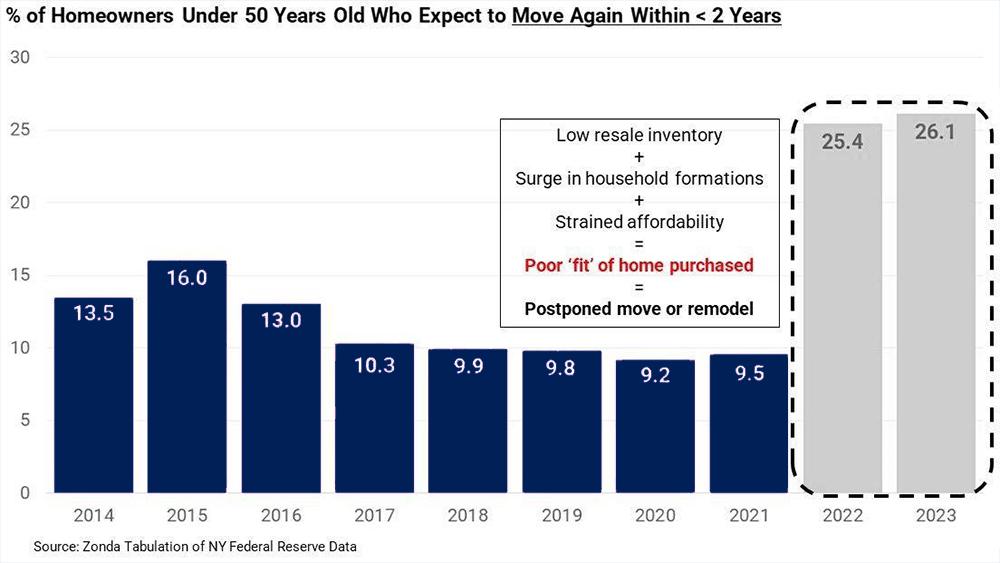
During the pandemic, there was a “frenzy” of people rushing to buy with a lot of bidding wars, buyers waiving inspections, and locking-in rates. But, now, a lot of those homeowners are dissatisfied. They rushed their purchase and ended up with a home that doesn’t suit them well.
As a result, a high number of people want to move in the next couple of years — about a quarter of homeowners under 50 (both this year and last year). Given the low availability of resale homes, these people are expected to either move when interest rates come down a bit or stay in their home and remodel it into a better fit. Zonda’s building and remodeling expert believes that 2023 could be the lowest mobility year on record, but that once the market’s stabilized, demand will likely increase.
If a builder’s focus is on entry level or first move-up homes, they need to figure out how their homes can fit people’s incomes. If a builder’s focus is the luxury market, their task is to build homes desirable enough that people want to move, despite a mortgage rate higher than their current rate. Neither is easy, but they are the challenges for builders in today’s market.
Builders FirstSource is ready to assist builders plan for these strategies. Find a location near you and talk to one of our local experts today.